From the plains of the Midwest to the sun-drenched deserts of the Southwest, geography plays a defining role in how energy is generated across the U.S. That’s because different regions come with different natural resources, which shape the mix of energy sources that power our lives. Some regions rely on fossil fuels, such as natural gas or coal, while others lead the way in renewable energy sources, including wind, solar, and hydroelectric power.
Understanding your local energy mix can help you make informed choices about your own electricity sources and support cleaner, more sustainable options.
The Major Types of Energy Sources
Electricity in the U.S. comes from a variety of power plants and stations, each with its own advantages and drawbacks in cost, efficiency, and environmental impact.
Fossil Fuels
Fossil fuels, mainly coal, natural gas, and oil, still generate more than half of U.S. electricity. Natural gas, in particular, has surged in recent decades, replacing coal in many states due to its lower emissions and lower market price.
Pros:
- Reliable source of electricity with consistent, around-the-clock generation
- Well-established infrastructure for production, distribution, and storage
- Proven technology with decades of operational history
- Often has lower short-term operating costs compared to some alternatives
Cons:
- Produce significant greenhouse gas emissions, contributing to climate change and air pollution
- Non-renewable resources with finite availability
- Prone to price swings and supply disruptions tied to global markets
- Increasingly subject to regulation as states and utilities pursue clean energy goals
Renewables
Renewable energy sources, such as wind, geothermal, solar, hydropower, and biomass, are replenished naturally, making them sustainable long-term options.
Pros:
- Generate little to no emissions during operation
- Reduce long-term dependence on fossil fuels and their associated environmental impacts
- Often have lower energy costs over time, aided by federal and state incentives
- Once built, the fuel source — sunlight, wind, or water — is free and inexhaustible
Cons:
- Electricity generation can fluctuate based on weather or seasonal conditions like sunshine, wind speed, or water availability
- Requires continued investment in storage technologies (such as batteries) to manage variability and maintain grid reliability
- Upgrades to transmission infrastructure are needed to connect renewable generation to where it’s most needed
Nuclear Energy
Nuclear power plants generate electricity by splitting uranium atoms, producing heat to create steam that drives turbines. Nuclear accounts for nearly 20% of U.S. electricity.
Pros:
- Produces a large, steady supply of electricity with no direct carbon dioxide emissions
- Operates with a high capacity factor, providing reliable baseload power
- Complements variable renewable sources like wind and solar by delivering consistent output
Cons:
- High upfront construction and financing costs
- Long permitting and development timelines can delay deployment
- Managing radioactive waste remains an unresolved environmental and policy issue
- Public safety concerns and regulatory hurdles continue to limit expansion in certain regions
Understanding Regional Differences in Energy Sources
Sunny states like Arizona and Nevada generate significant amounts of solar power, while windy plains states such as Iowa and Kansas are national leaders in wind. Hydropower dominates in mountainous, river-rich regions like Washington, Oregon, and Idaho.
Meanwhile, states with extensive fossil fuel infrastructure — such as Texas, which relies heavily on natural gas, and Wyoming, which is heavily reliant on coal — continue to rely on those resources, although many are gradually diversifying. These regional differences highlight why policies and incentives at the state level play such a major role in shaping the future of clean energy use.
Energy Sources in The USA: A State-by-State Breakdown
The U.S. Energy Information Administration (EIA) offers detailed data on electricity generation in every state:
(Regional shading: light blue = Northeast, light green = Midwest, light yellow = South, light orange = West)
| State | Dominant Energy Source(s) | Notable Facts |
| Northeast | ||
| Maine | Hydropower, wind | Working toward a high renewable share (~61%). |
| New Hampshire | Natural gas, nuclear | Gas leads; nuclear contributes. |
| Vermont | Hydropower, biomass, wind | 100% renewable in-state; hydro dominates (>56%). |
| Massachusetts | Natural gas, renewables | Gas leads; renewables rising. |
| Rhode Island | Natural gas | Gas leads generation. |
| Connecticut | Natural gas, nuclear | Gas dominates (>55%), nuclear second (~39%). |
| New York | Natural gas, hydroelectric | Hydro from Niagara plus gas; offshore wind power is expanding. |
| Pennsylvania | Natural gas, nuclear | Gas and nuclear dominate generation. |
| New Jersey | Natural gas | Gas leads generation. |
| Midwest | ||
| Ohio | Natural gas, coal, nuclear | Natural gas has been at the top since 2019, ~59% in 2023. |
| Indiana | Coal, natural gas, wind | Coal primary (~45% in 2023); gas second; wind ~10%. |
| Illinois | Nuclear, natural gas, wind | Produces more nuclear electricity than any other state. |
| Michigan | Natural gas, nuclear, coal | Gas led in 2023 (~46%); nuclear ~23%, coal ~19%. |
| Wisconsin | Natural gas, coal, nuclear | Gas largest (~43% in 2023); coal ~32%. |
| Minnesota | Wind/renewables, natural gas, nuclear, coal | Renewables led in 2023 (33%), mostly wind. |
| Iowa | Wind, natural gas, coal | Wind farms produced~59% in 2023; highest share in U.S. |
| Missouri | Coal, natural gas, wind | Coal provided the largest share in 2023. |
| North Dakota | Coal, wind | Coal ~55% and wind ~36% in 2023. |
| South Dakota | Wind, hydroelectric | Renewables ~77% in 2023; wind exceeded hydro by 3:1. |
| Nebraska | Coal, wind, nuclear, natural gas | Coal ~45% in 2023; wind ~30%, nuclear ~17%. |
| Kansas | Wind, natural gas, coal | Wind ~46% in 2023; third-highest share nationally. |
| South | ||
| Delaware | Natural gas | Over 96% from fossil fuels—mostly gas. |
| Maryland | Natural gas, nuclear | Gas leads; nuclear and renewables present. |
| West Virginia | Coal, natural gas | Coal leads; gas is growing. |
| Virginia | Natural gas, nuclear | Both major sources, renewables rising. |
| Kentucky | Coal, natural gas | Coal dominant; gas increasing. |
| North Carolina | Natural gas, nuclear | Gas (~41%) and nuclear (~32%) lead. |
| South Carolina | Nuclear, natural gas | Nuclear strong; gas present. |
| Georgia | Natural gas, nuclear | Gas leads (~41%); nuclear second (~34%). |
| Florida | Natural gas, nuclear | Gas leads; nuclear contributes; solar expanding. |
| Alabama | Natural gas, nuclear | Natural gas leads; strong nuclear share (~32%). |
| Mississippi | Natural gas, coal | Gas leads with coal still in the mix. |
| Tennessee | Natural gas, nuclear | Both sources lead generation. |
| Arkansas | Coal, natural gas, nuclear | Coal and gas split; nuclear important too. |
| Louisiana | Natural gas, coal | Natural gas primary; coal still used. |
| Oklahoma | Wind, natural gas | Wind share (~42%) high; gas remains key. |
| Texas | Wind, natural gas, solar | Wind leader; gas and solar growing. |
| West | ||
| Montana | Coal, hydroelectric | Coal leads; hydro supports renewable share (~58%). |
| Wyoming | Coal, wind | Coal leads; wind growing. |
| Colorado | Coal, natural gas, wind | Coal leads; wind notable (~26%). |
| New Mexico | Natural gas, wind | Wind rising; gas leads. |
| Arizona | Natural gas, nuclear, solar | Gas leads; solar and nuclear significant. |
| Utah | Natural gas, coal | Gas and coal dominant; solar increasing. |
| Nevada | Natural gas, solar | Solar >30%; gas remains main source. |
| Idaho | Hydropower | Among highest renewable electricity shares (>75%). |
| Washington | Hydroelectric | Hydro over 60% of electricity; very high renewable share. |
| Oregon | Hydropower, wind | Hydro dominates; wind growing. |
| California | Natural gas, solar, hydroelectric | Natural gas is top; strong solar and hydro. |
| Alaska | Natural gas, hydroelectric | Natural gas dominates; hydro supports. |
| Hawaii | Petroleum | Unusually, petroleum supplies most electricity. |
Source: U.S. Energy Information Administration (EIA) State Energy Profiles and Electricity Data Browser, accessed August 2025; Nuclear Energy Institute (NEI); and state-level renewable energy data from EPA and state energy offices.
For more details about your own state, the EIA’s state profiles and the EPA’s Power Profiler tool provide real-time or recent insights into your local power generation.
The Rise of Renewable Energy
Many states are setting ambitious clean energy goals, with several committing to 100% renewable electricity in the coming decades.
Leaders in Wind Energy:
- Iowa
- Kansas
- Oklahoma
Leaders in Solar Power:
- California
- Arizona
- North Carolina
Hydropower Hubs:
- Washington
- Oregon
- New York
This growth is fueled not only by natural resources but also by policies like renewable portfolio standards (RPS), clean energy standards (CES), and net-metering laws. Tax credits, rebates for solar panels, and small-scale energy programs are making it easier for homeowners and businesses to adopt clean energy solutions.
For homeowners interested in solar, time is of the essence. Under current law, the 30% federal tax credit for residential solar, formally called the Residential Clean Energy Credit, will expire at the end of 2025. To qualify, systems must be installed and operational by December 31, 2025. This credit applies only to systems that are purchased outright, either with cash or a loan. Homeowners using third-party ownership models, like leases or power purchase agreements (PPAs), are not eligible to claim the credit directly.
However, large-scale renewable energy projects and third-party-owned residential systems can still benefit from separate federal incentives, such as the Section 48E credit, which remains in effect through at least 2027. These credits help reduce the cost of developing wind and solar projects, making renewables increasingly competitive with fossil fuels on a per-kilowatt-hour basis.
States With 100% Clean-Energy Goals
Currently, 24 states plus the District of Columbia and Puerto Rico have gone beyond incremental targets, committing to 100% clean or renewable electricity within the next few decades. Some of the big ones include:
- New York: 100% zero-emission electricity by 2040
- Minnesota: 100% carbon-free electricity by 2040
- Illinois: 100% clean energy by 2050
- Massachusetts: Net-zero greenhouse gas emissions by 2050, with 100% clean energy targets under its roadmap
- California: 100% clean energy by 2045
- Hawai‘i: 100% renewable electricity by 2045 (the first state to set such a goal)
- Oregon: 100% clean electricity by 2040
- Virginia: 100% clean energy by 2045 (Dominion Energy) / 2050 (Appalachian Power)
These policies are often paired with incentive programs, funding for grid modernization, and requirements to include low- and middle-income households in renewable energy programs. Together, they create momentum that drives investment in technologies like community solar and battery storage.
These ambitious state-level goals align with Clearway Community Solar’s mission to make renewable energy accessible to households and businesses. By subscribing to a local solar farm, customers in states like New York, Minnesota, Illinois, and Massachusetts can directly contribute to meeting these targets while saving on their electricity bills.
Why It Matters: The Environmental Impact of Your Energy Source
When power plants burn fossil fuels, they emit greenhouse gases that contribute to climate change and air pollution. Increasing the share of renewable energy in the power grid can reduce emissions, improve air quality, and protect ecosystems. Every shift toward clean energy, whether at the utility-scale or through small-scale projects, helps lower our environmental footprint.
The type of energy we use also affects public health and community well-being. Fossil fuel power systems release fine particulate matter, nitrogen oxides, and sulfur dioxide, which are linked to asthma, cardiovascular disease, and premature death. These impacts often fall disproportionately on communities living closest to power plants and industrial corridors.
Transitioning to cleaner energy sources not only reduces greenhouse gas emissions but also delivers direct health and equity benefits, lowering healthcare costs and creating healthier living environments for millions of Americans.
How Consumers Can Choose Cleaner Energy
Small-scale programs, such as rooftop solar rebates, efficiency incentives, and federal tax credits for clean energy adoption, make it easier for homeowners and businesses to participate in the transition. Checking your state’s energy office or utility website, or DSIRE (the Database of State Incentives for Renewables & Efficiency), is the best way to see which programs, rebates, and incentives might be available where you live.
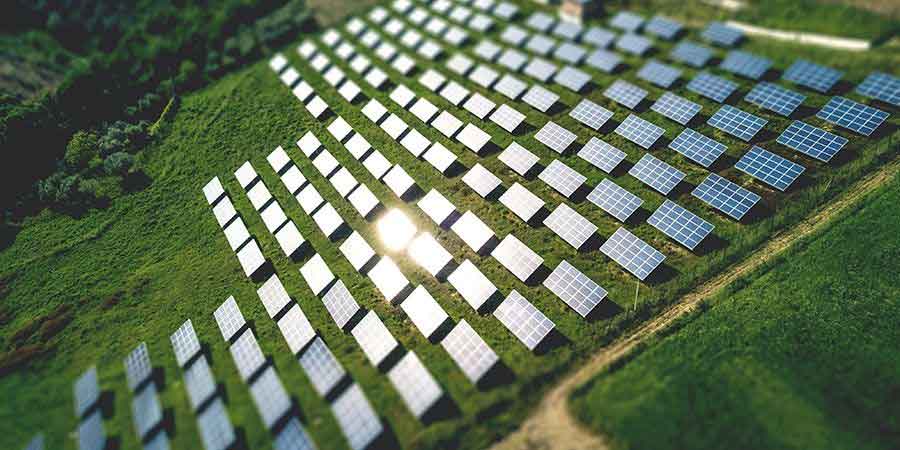
Even if you can’t install solar panels on your roof, you can still support renewable energy. One option is community solar, where you subscribe to a shared solar farm and receive credits on your electricity bill for your share of the power it produces. This allows you to directly back solar energy without the cost or maintenance of owning panels.
Not sure about all the terms? Our solar glossary can help you get familiar with the language of clean energy.
Getting Started With Clearway Community Solar
Clearway Community Solar makes it simple to join the clean energy movement. By subscribing to a local solar farm, you help add renewable electricity to the power grid and receive bill credits based on your share of the amount of electricity generated.
Ready to power your home with clean, community-based energy? Signing up is simple! No rooftop panels, no upfront costs, and no hidden fees. Subscribe to a local solar farm, start receiving bill credits based on how much clean electricity you use, and help bring more renewable power to your electric grid.
Visit Clearway Community Solar today to request a free quote and start saving with confidence.
