Parental Note: This experiment is geared towards ages 10 and up. The project may require some support to poke holes in the milk jug with a nail, take measurements and keep a record of elapsed time. This experiment involves flowing water and should be performed in a location that can get wet (e.g. in a bathtub, shower or outdoors).
Additional Note: This experiment will take roughly 1 hour to complete.
Experiment Overview:
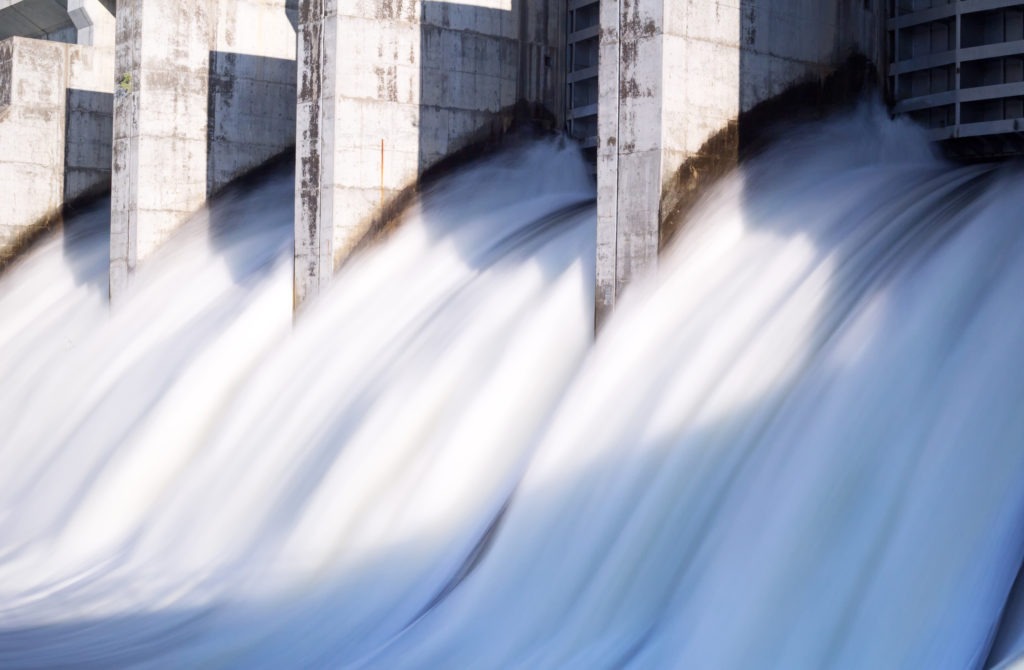
Water is a natural resource that is essential to life on Earth. Water is also very useful to people because flowing water creates energy that can be captured and turned into electricity. We call this form of renewable energy generated from flowing water or water stored in dams, hydropower. A dam is a structure that blocks or restricts the natural flow of water so that the water can be held in a large standing body of water (reservoir) where it is used to generate electricity. As the dam holds back more and more water in the reservoir, the water accumulates potential energy (stored energy). This energy is transferred into kinetic energy (energy in motion) when the water is released from the dam. An opening in the dam uses gravity to drop water down a pipe called a penstock, and the moving water spins the rotary blades of a turbine that powers a generator. Pressure, reservoir height (water level) and the location of the penstock play an important role in how efficient a hydroelectric dam is at producing energy. In this activity, you will create your own hydropower milk jug and poke holes at different points along the dam wall to investigate the places where the pressure and the potential for generating electricity is the greatest.
Before beginning, think about the following questions and write down your predictions:
- What you think will happen when you fill the milk jug up with water and remove the duct tape that is covering the holes?
- Do you think the water streams from the three holes will all be the same length?
- What do you think will happen to the length of each stream over time as the water level goes down inside of the milk jug?
Experiment Materials:
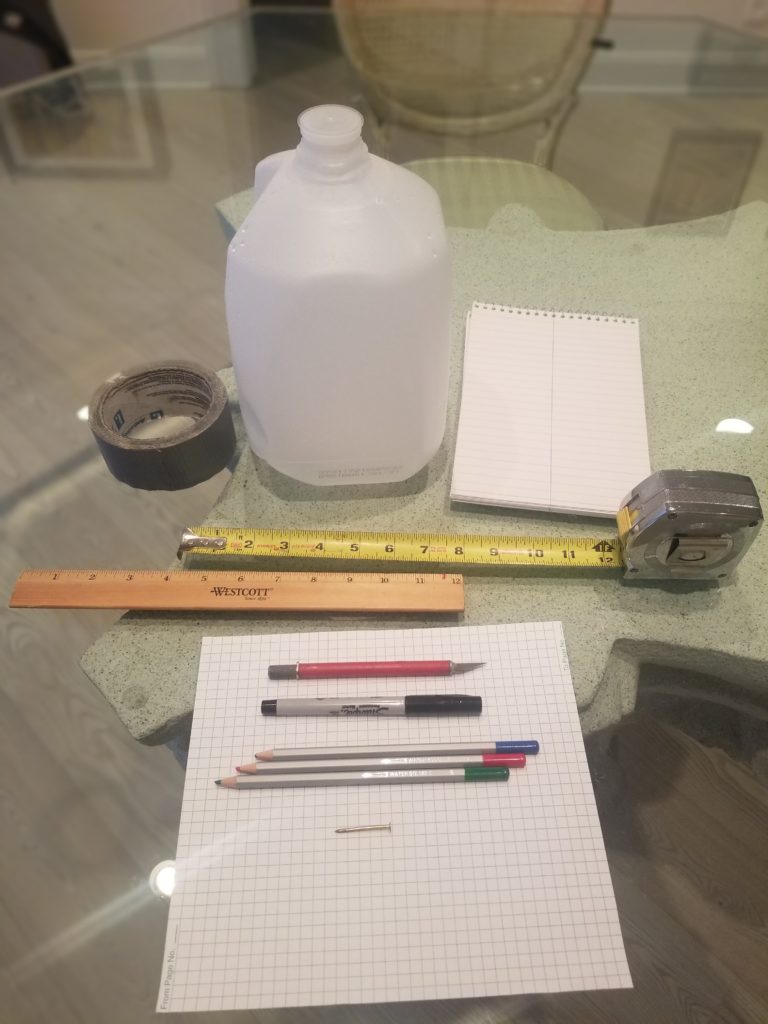
- 1-gallon plastic milk jug
- 1 permanent marker
- Colored pencils
- Ruler
- 1 small nail, about 1 inch long
- Duct tape
- Tape measure
- Stepping stool, or bricks or blocks of wood
- Timer (you could use a watch or a phone’s timer)
- Lab notebook
- 1 sheet of graph paper
Experiment Process:
Step 1
Rinse out the milk jug so it is clean and throw away the cap.
Step 2
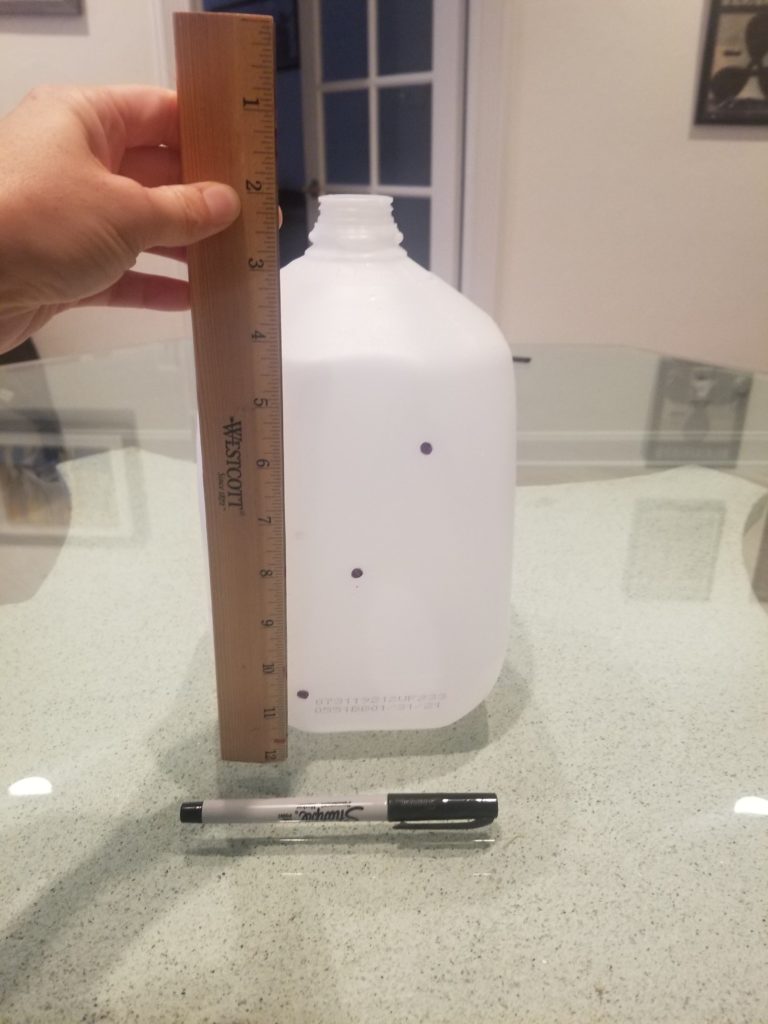
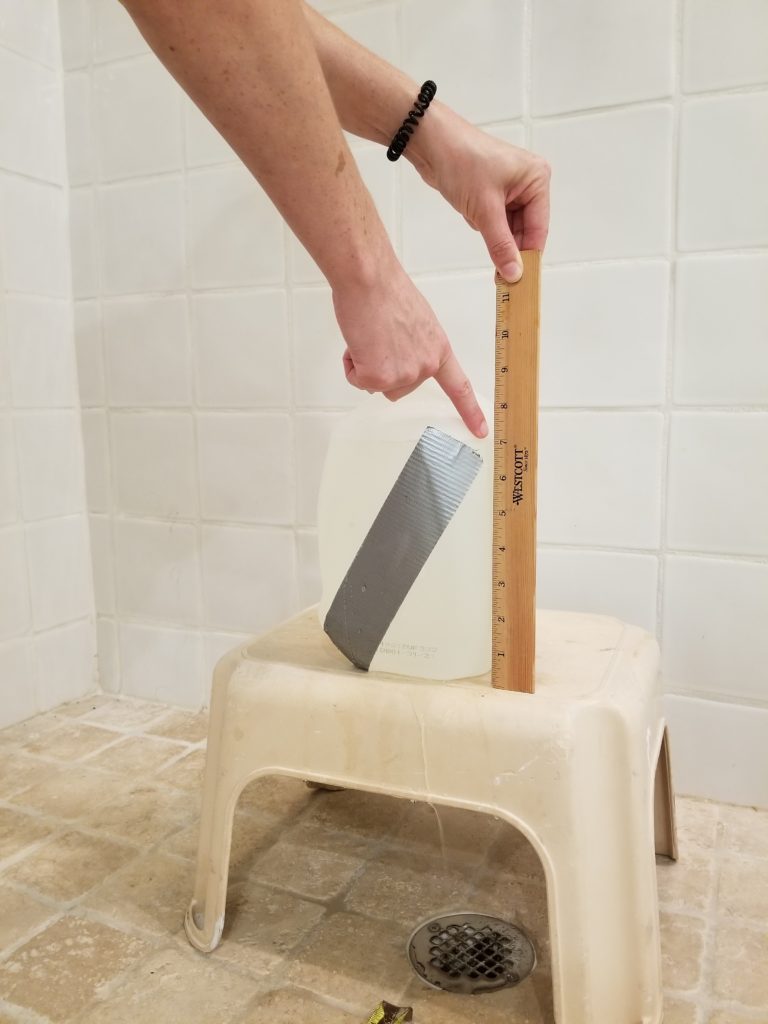
Make three marks with a permanent marker and a ruler on the side of the milk jug opposite the handle.
- Make the first mark in the center of the side, 3.5 inches up from the bottom.
- Make the second mark 1 inch to the left of the center mark and 1 inch up from the bottom.
- Make the third mark 1 inch to the right of the center mark and 6 inches up from the bottom.
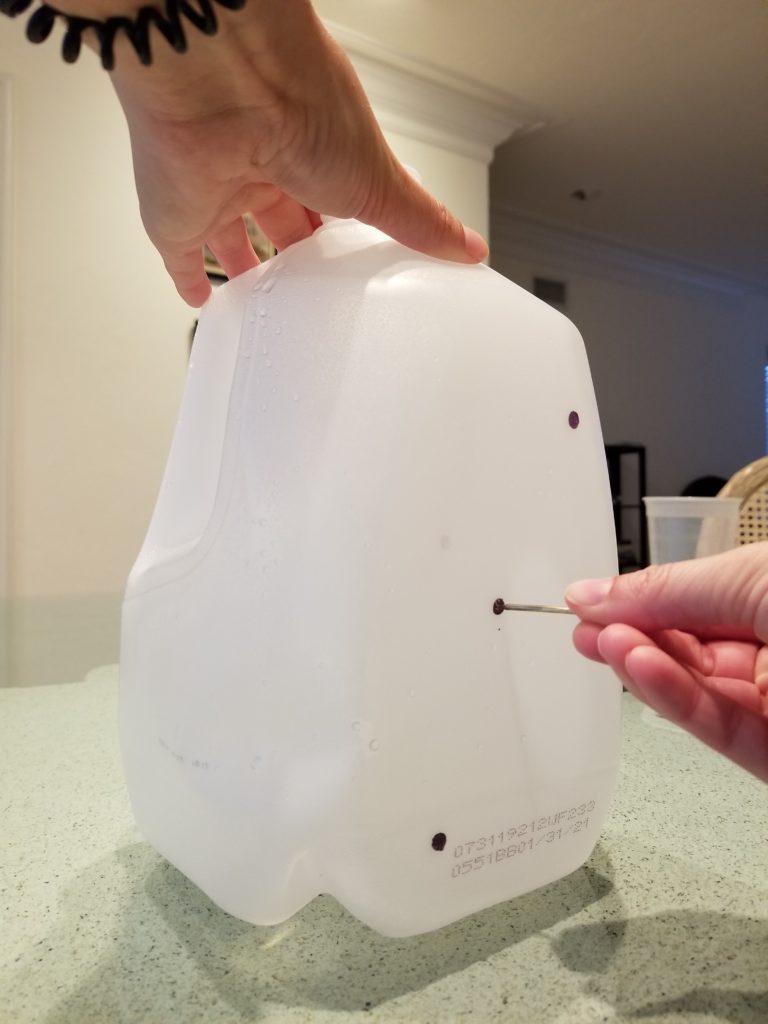
Step 3
Carefully press a 1-inch nail through each mark and twist back and forth to make sure that you have made well-defined circular holes.
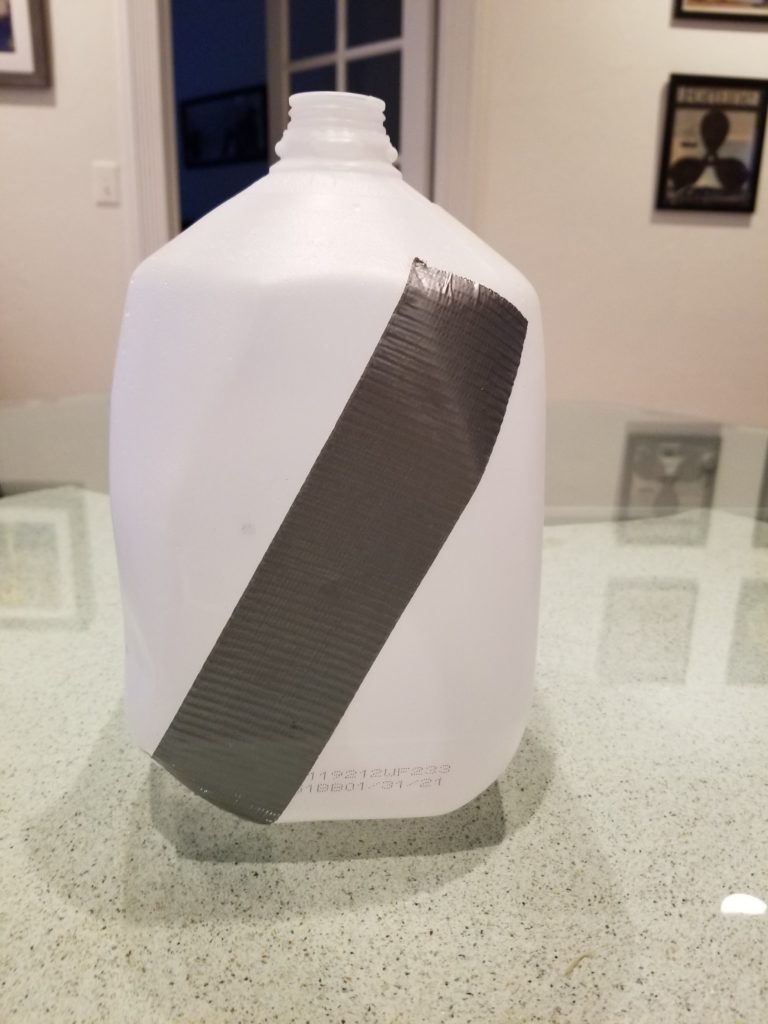
Step 4
Cover all 3 holes with a strip of duct tape. Press firmly to make sure the holes are sealed and water cannot pass through.
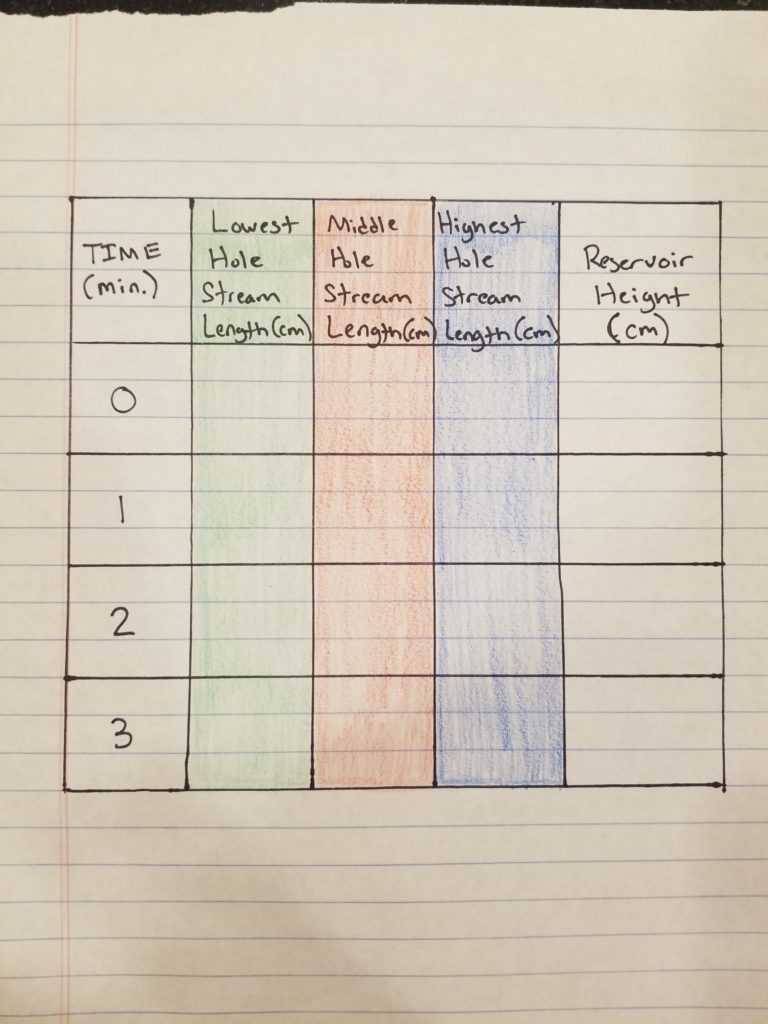
Step 5
Make a data table in your lab notebook. Use a different colored pencil for each hole (e.g. green for “lowest hole,” red for “middle hole,” and blue for “highest hole”).
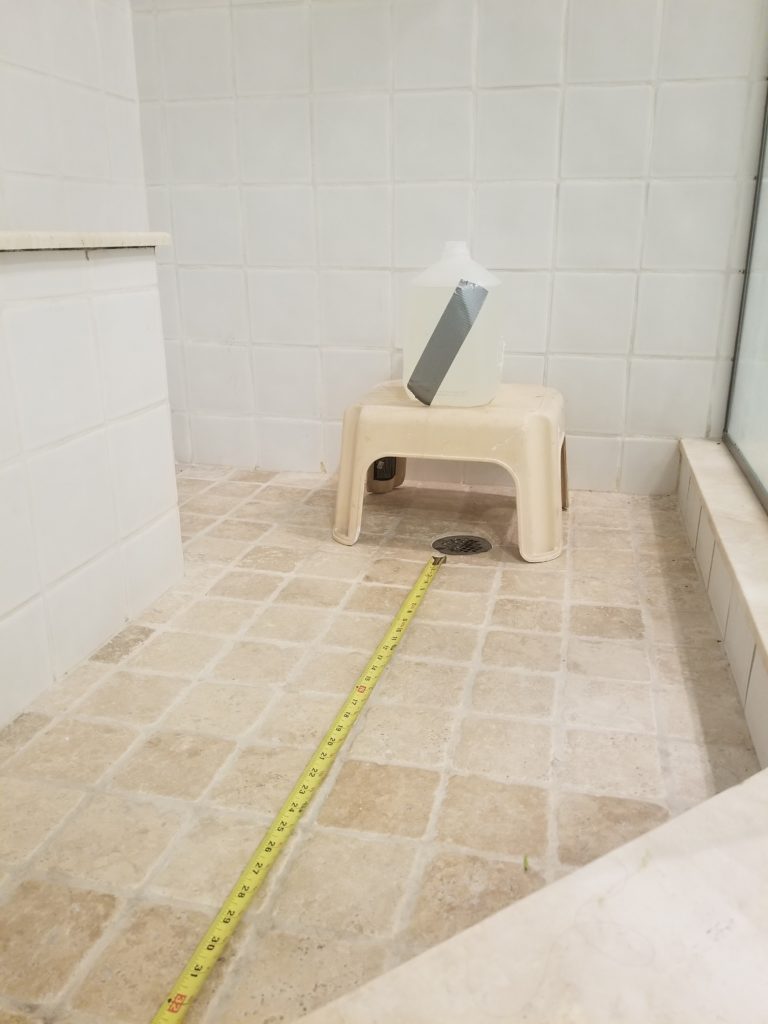
Step 6
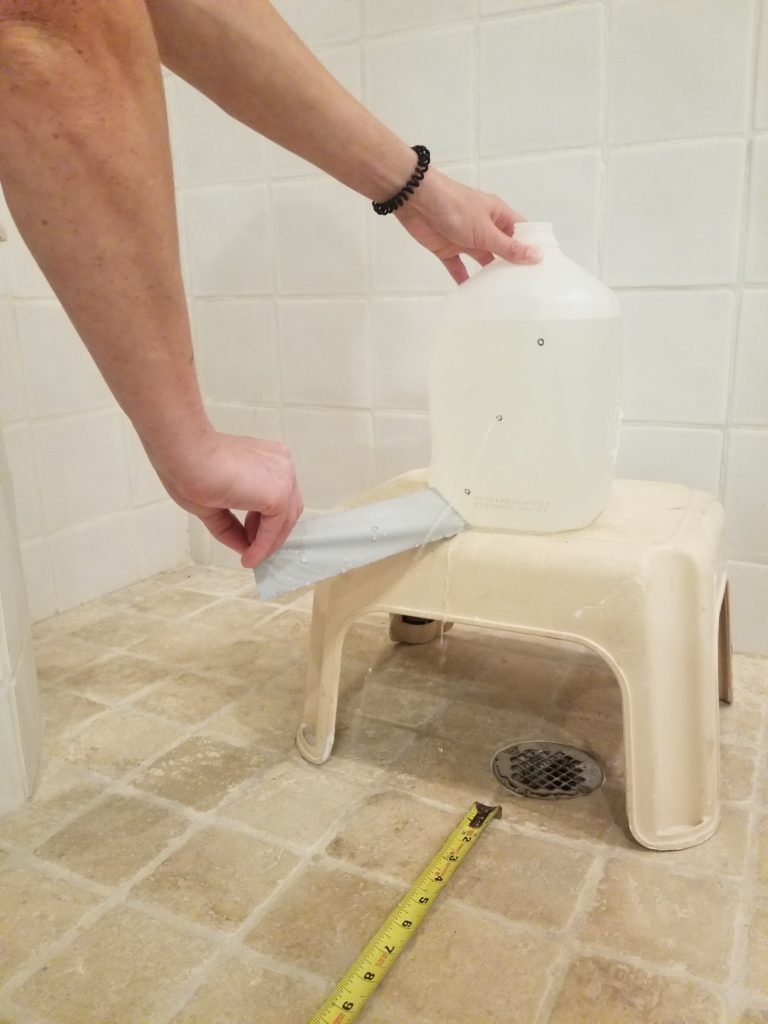
Ask a parent to help you find a good test area that is able to get wet (e.g. in a bathtub or outside). Place a stepping stool in your test area and place the milk jug on top of the stool. Extend a tape measure from the base of the milk jug and lock it so that it stays in place on the floor in front of the milk jug.
Step 7
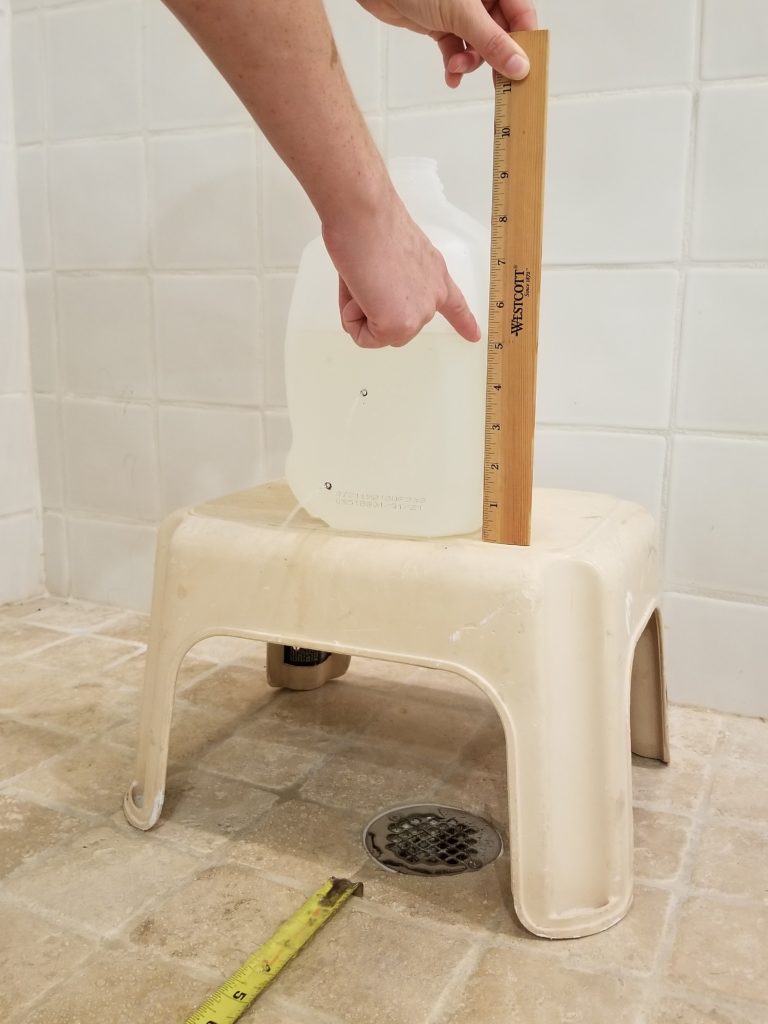
Fill up the milk jug with water. Set your timer to zero. Record your starting reservoir height in the data table (time “0”). You may choose to record measurements in either inches or centimeters. To measure reservoir height, use a ruler and measure the distance from the bottom of the milk jug to the surface of the water. You will record the reservoir height once every minute throughout the experiment.

Step 8
Remove the duct tape from the milk jug and start your timer immediately.
Step 9
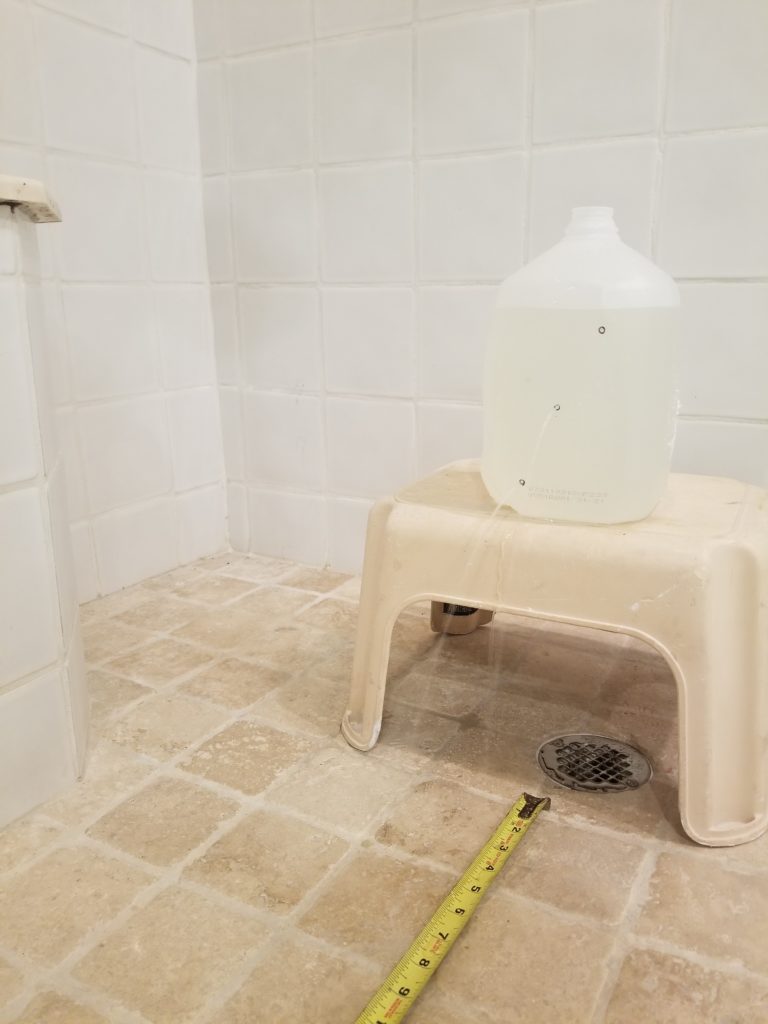
Refer to the tape measure to determine the length of each water stream and record in your data table for time “0.” You will record the water stream length for each hole every minute throughout the experiment.
Step 10
Continue to keep time and record both the reservoir height and length of each water stream every minute until all of the water runs out.
Share Your Results
- Graph your data. Use a ruler to draw a line graph of your data, with time on the x-axis and stream length on the y-axis. Use a different colored pencil to graph the data for each hole (e.g. green for “lowest hole”, red for “middle hole” and blue for “highest hole”).
- Do the shapes of the line graphs look the same for all three trials?
- Which hole produced the longest stream length?
- Which hole produced the shortest stream length?
- Based on your results do you think the water pressure on a dam wall is greatest at the bottom of a dam, middle, or the top?
- At which hole depth do you think the most electricity can be produced?
Conclusions:
Pressure, reservoir height (water level) and the location of the penstock play an important role in how efficient a hydroelectric dam is at producing energy. Pressure in the reservoir increases as the distance between the surface of the water and the opening to the penstock increases. As the reservoir height of the dam increases, the pressure of water inside the reservoir increases and therefore so does the amount of electricity that can be generated. Through your experiment, you may have noticed that the pressure in the dam was the greatest when the reservoir was full. All 3 streams were flowing at their maximum length when the reservoir was full. As the reservoir height got lower, the stream flowing from the hole closest to the surface of the water became shorter and shorter until it disappeared. The same thing would have happened to the middle hole, and eventually, the bottom hole. The hole at the bottom of the milk jug was in the best position to transfer water to generate electricity because of the greater amount of pressure being exerted on it from the water above.
Hydropower has several advantages, such as being a renewable and pollution-free source of energy. The disadvantages are that large dams can have environmental impacts by changing the environment and affecting the natural flow of water. Dams can also block migratory fish (such as salmon) from swimming upstream to reach their spawning grounds.
Extension:
What would happen if you made a horizontal row of holes, all at the same height, in the dam wall? Would the stream lengths all be the same? Write down your hypothesis and test it out!

")

Want to learn more about Community Solar?
Our solar specialists can provide a free consultation.
Get Started