Parental Note: This experiment is geared towards ages 10 and up.
Additional Note: The project will take roughly one hour to set up. It will take up to five days to allow enough particles to settle on the experimental cards you set out. Adult assistance may be required to help hang cards from tree branches and other locations near your home.
Experiment Overview:
We all need to breathe clean air to stay healthy. Many people who live in industrial areas (such as near a factory) develop asthma and other respiratory or breathing problems due to the high number of particles (such as dust and soot) and pollutants (such as smog, smoke, and chemicals) in the air that they breathe. These pollutants mostly come from factories, power plants, and fossil-fuel burning vehicles. Approximately 43.3 percent of the population, live in areas that have monitored unhealthy ozone and/or particle pollution. Dust and pollen in the air can also cause people with allergies to have respiratory problems.
In this experiment, you will test the air quality at different locations in and around your home by using index card paper and petroleum jelly to “catch” particulate matter from the air. You will then use a magnifying glass to observe and measure the amount of air particulate air pollutants collected over 5 days from each location.
Before you begin the experiment, answer the following questions:
- Based on what you know about your home and neighborhood, which types of particles do you expect to find in the air that you breathe?
- Of the three locations you chose to run your experiment, which one do you think will have the highest average number of particles per square?
Experiment Materials:
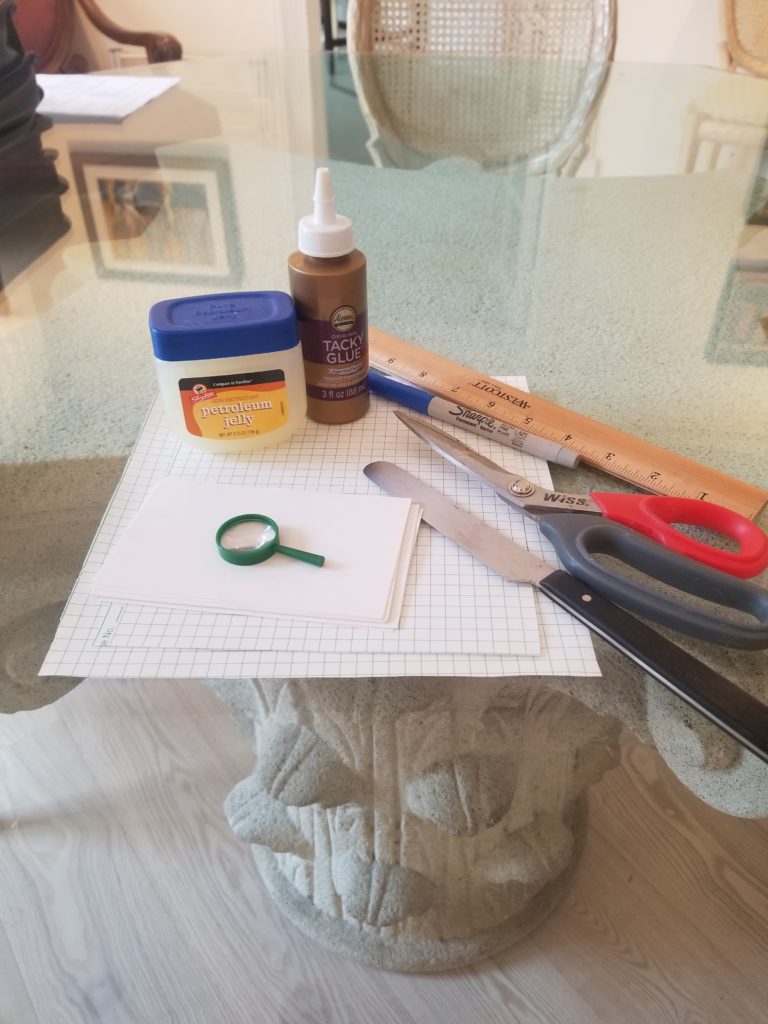
- 3 index cards
- Graph paper (or use a pencil and ruler to draw a grid on each index car)
- Glue
- Petroleum jelly
- Butter knife or plastic knife
- String or fishing line
- Magnifying glass
- Calculator
- Permanent marker
- Pencil
Experiment Process:
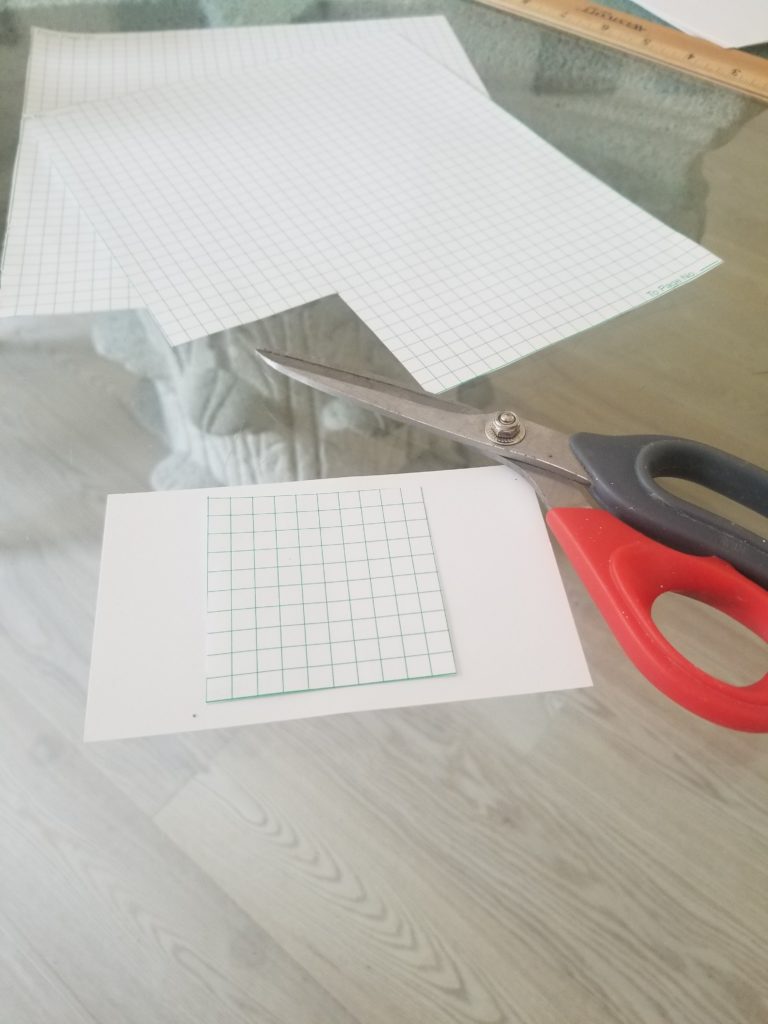
Step 1
Trim each piece of graph paper to an equal area of 10 x 10 squares. If your squares are large and a 10 x 10 grid will not fit on your index card, you may need to use an area of 5 x 5 squares instead. If you do not have graph paper, you may wish to use a ruler and pencil to neatly draw a grid on each index card. It is important that the size of the grid on each card is the same so that you can compare the results later.
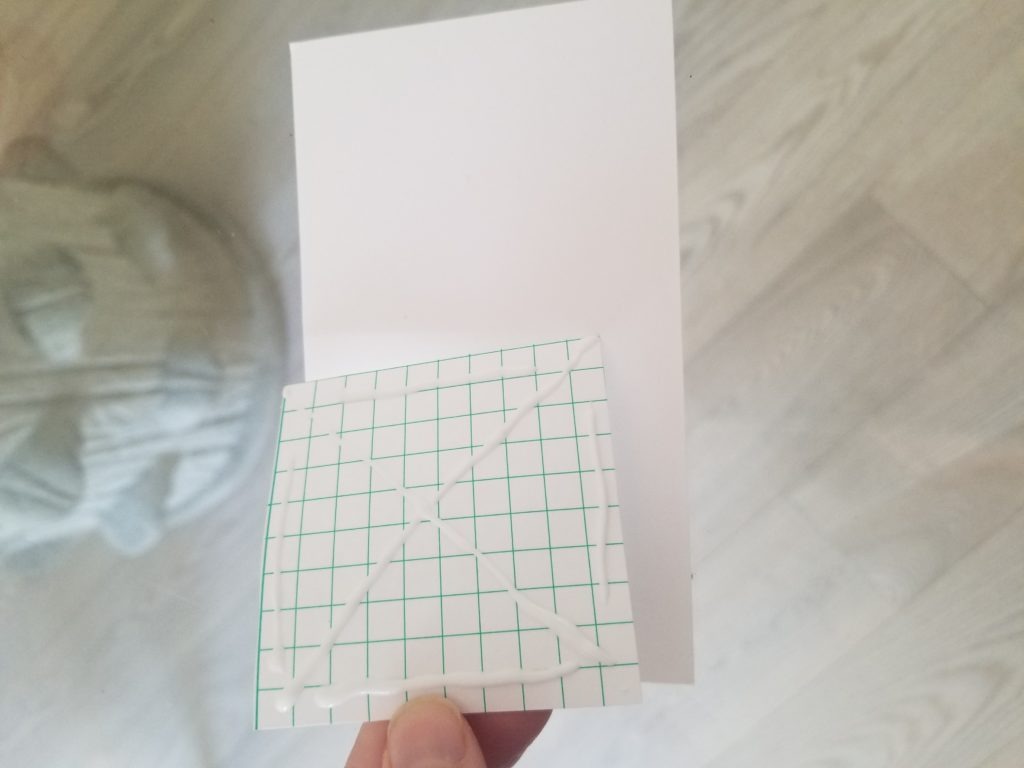
Step 2
Once your grids are trimmed, glue one onto each index card and let the glue dry.
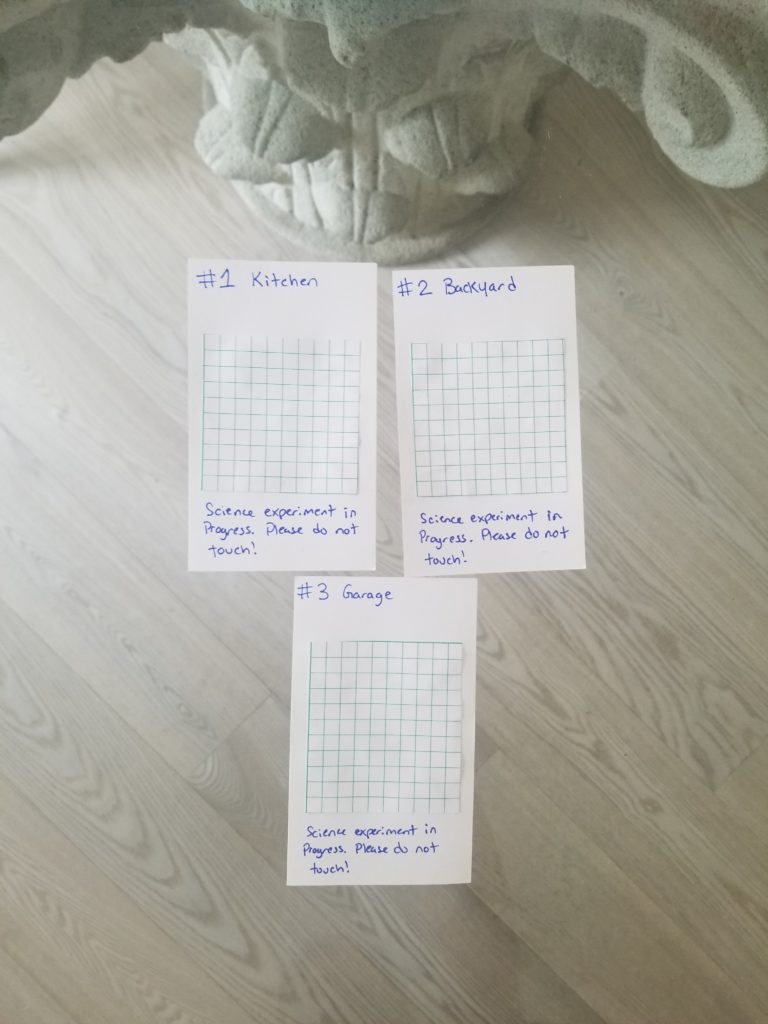
Step 3
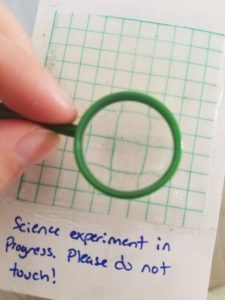
Label each card with a number and location. You may want to write “Science experiment in progress; please do not touch” on the index cards so no one removes them.
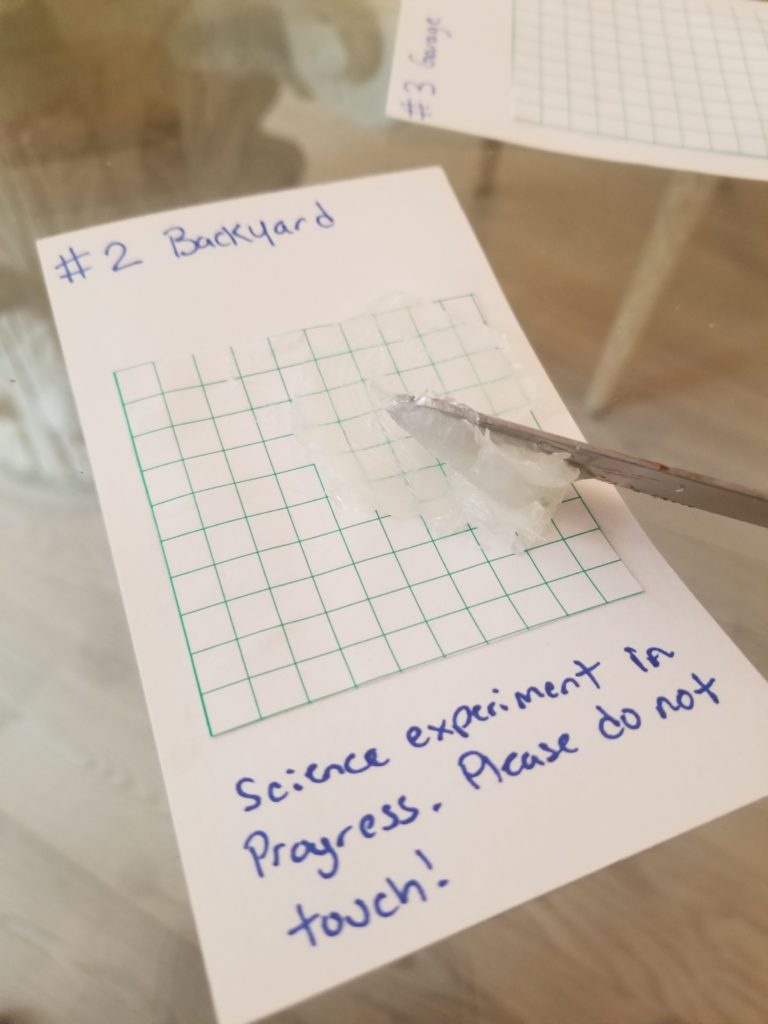
Step 4
Use the butter knife to spread an even layer of petroleum jelly and cover the entire area of the grid.
Step 5
Tie a piece of string to each index card.
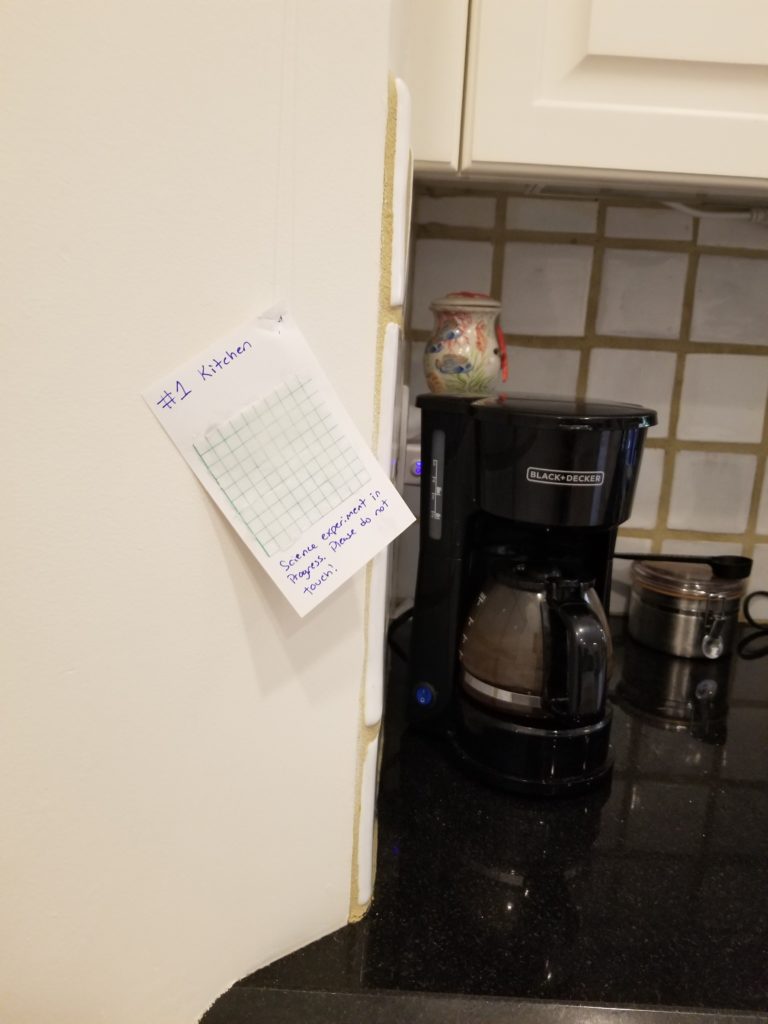
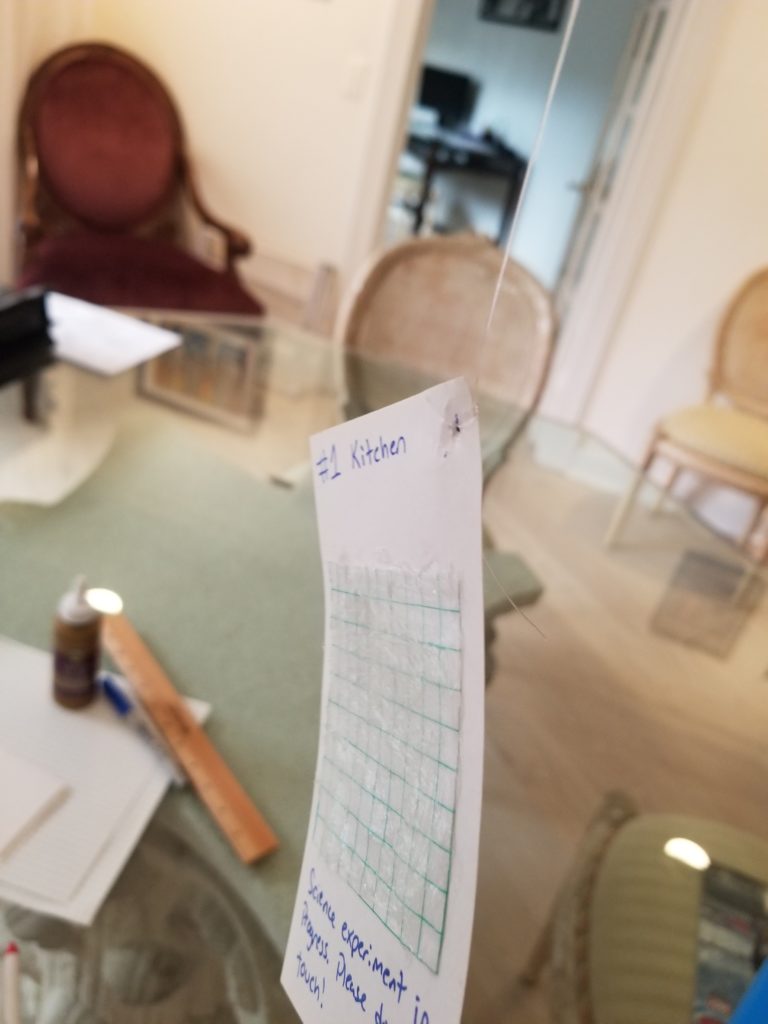
Step 6
Use the string to hang the index cards from different locations in and around your home. Ask an adult for help if you will be hanging a card from a tree branch or any other hard to reach places.
Step 7
Wait 5 days for particles to settle on the petroleum jelly. Check the weather each day in the morning. If it is going to rain, you may need to end your experiment early so the cards do not get wet! The experiment should still work as long as the cards hang for at least 24 hours, but works best if you let them sit for 5 days. Pick a time frame that works best for you based on the weather and your schedule.
Step 8
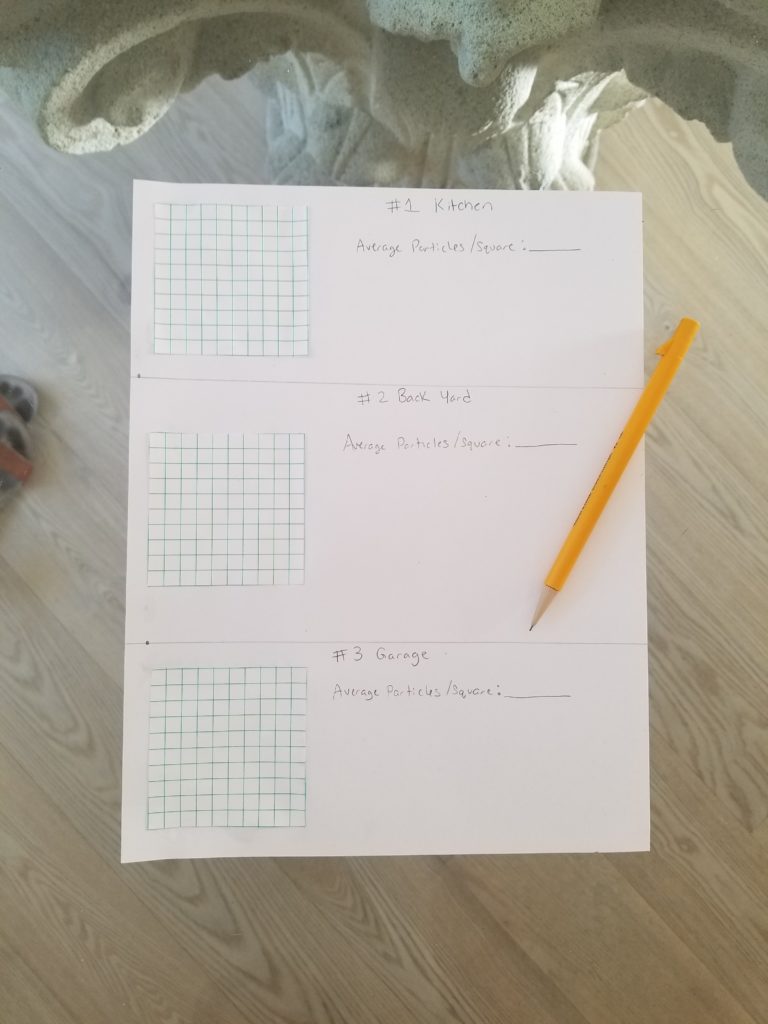
Create a table for each index card to record your results. The tables should have the same number of squares as the grid on the index cards (see example to the left).
Step 9
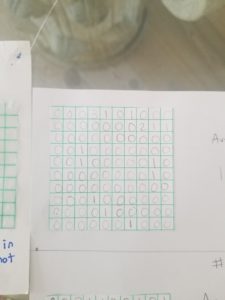
Collect the cards and use a magnifying glass to count the number of particles found within each square on each index card. Record your results in the squares of your data tables.
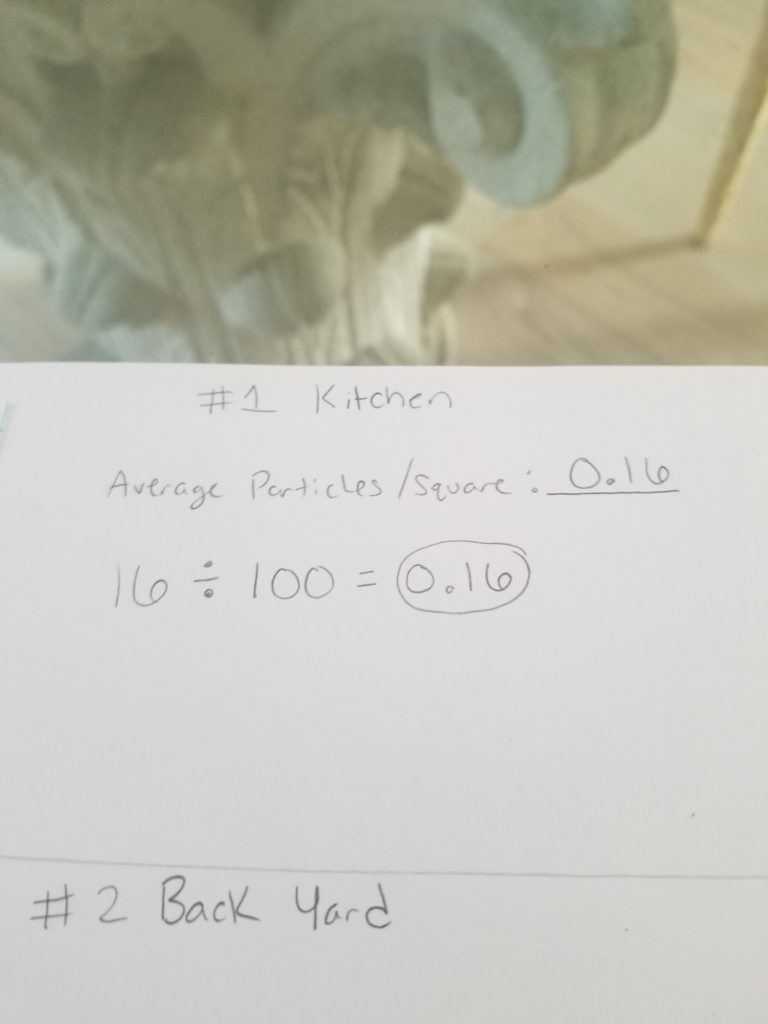
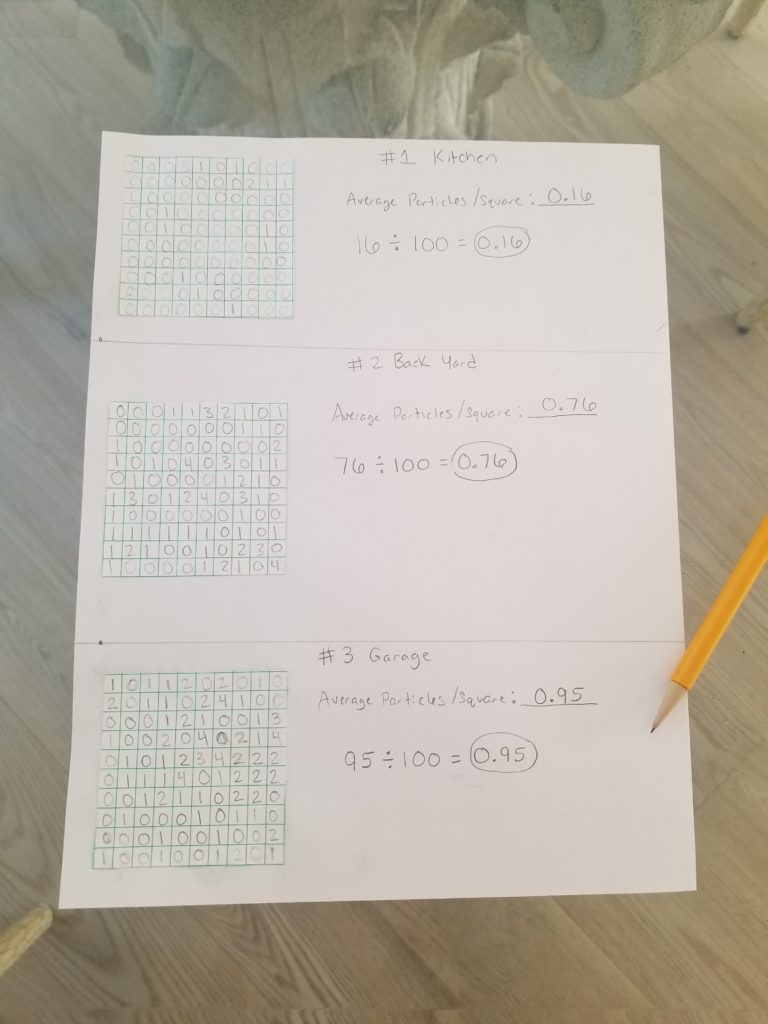
Step 10
For each index card, calculate the average number of particles found in each square. Do this by adding up the total number of particles found on the card and divide by the number of squares (for example, if you did a grid of 5 x 5 squares you will divide by 25).
Conclusions:
Which location did you find to have the poorest air quality (the location with the most particles)? Is this what you expected? If not, can you think of any reason why the air quality was lower in that location? You may need to do some investigating here. If you found a lot of particles from a room inside of your home, ask an adult if the air filters in the house have been changed recently. If you found that the air quality outside of your home was low, you could look around to see if perhaps there are a lot of flowers and trees that produce pollen nearby. You may also want to use the internet to see if there are any factories or power plants nearby that you did not know about before. Do you live in a city? Are there a lot of cars driving on your street every day that could explain the high amount of particles you saw?
There are many tiny particles in the air that we breathe. Some of them are naturally occurring such as pollen, dust, hair and dirt, while others come from man-made sources such as industrial factories, power plants and cars. If we all chose to use more clean sources of energy and transportation, we will have cleaner air to breathe. Instead of using energy from natural gas and coal, which emit pollutants, people can use solar, wind and hydroelectric power sources, which are considered “clean energy” sources.
Extension:
You may wish to do this experiment using more than 3 index cards to compare other locations near your home.
You could also run the same experiment more than once to make sure your results are accurate. Scientists often will replicate experiments several times to see if they can get the same result each time. If you want to make this a long-term experiment, you could choose to do this same experiment a few times in the summer and a few times in the winter and compare to see if there is any seasonal difference in air quality near you.
Do you live near an industrial area? If so, you could place one or more of the cards at a park or other public space closer to the industrial buildings or power plants (ask an adult for permission). When you do this, do you notice a major difference in the air quality as you get closer to the industrial part of town?

")

Want to learn more about Community Solar?
Our solar specialists can provide a free consultation.
Get Started