Parental Note: Looking for kid-friendly science experiments you can do at home? This cool science experiment is geared towards ages 10 and up to be completed independently. The science project may require some support to gather materials and complete the data chart needed for both outside temperature and the internal temperature of materials. The activity can also be completed by younger children (ages 7 and up) as a fun science experiment, but parental/adult support would be needed for all steps. This science activity is not recommended for preschoolers.
Additional Note: This science experiment will take roughly 5 hours to complete; this calculation takes into consideration both setup time and the time needed to collect and analyze data. It could also make an excellent project for the school science fair.
Experiment Overview:
When an object is heated by the sun, without any mechanical systems, the heating process is known as passive solar heating. Have you ever wondered how long an object can hold onto heat before it cools down? The amount of heat an object can hold over time is called heat retention. Different objects might retain heat better than others.
In the first part of this fun activity, we will use the sun to heat objects, and then track the total heat absorption for each item. In the second part of this experiment, we will move the objects into the shade, eliminating the sun’s direct light. As the objects begin to lose heat, we will chart the overall heat retention and loss for each object.
Before beginning, think about the following three questions and make predictions:
- What do you think will happen to the materials when left in the sun for 120 minutes (2 hours)?
- What will happen to each material when moved into the shade for 120 minutes (2 hours)?
- Do you think there will be a big difference between the temperature of the objects in the sun and the temperature of the objects in the shade?
Experiment Materials:
This science activity is designed to be a simple experiment that can be completed with common household items or outdoor materials.
- 6 Ziplock bags (bags must be clear)
- 1 cup of each:
- Gravel or rocks
- Wood chips or mulch
- Leaves
- Dirt
- Sand
- Grass cuttings
- Cooking thermometer (click here for example)
- Outdoor thermometer or weather app
- Science notebook to collect data or a sheet of paper
- 6 pieces of white construction paper or white printer paper
- Pencil/Pen (different colors are okay)
- Timer or clock
Experiment Process:
Step 1
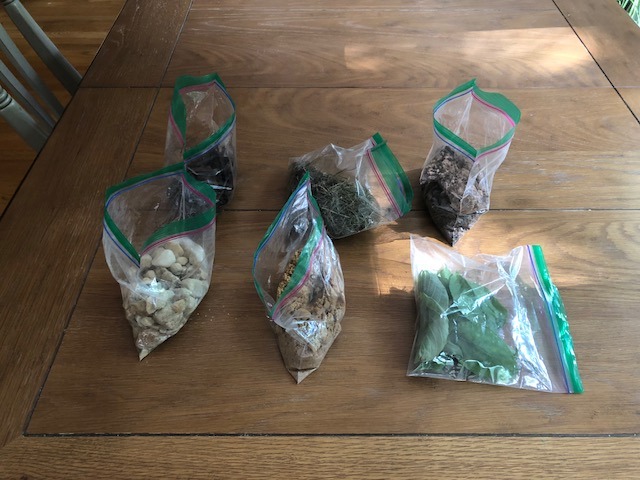
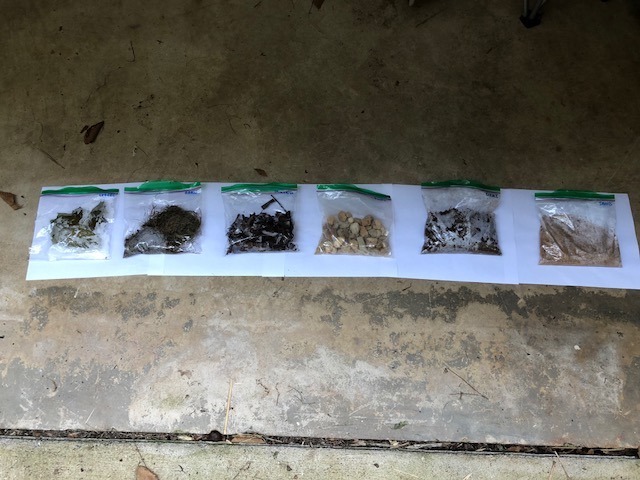
Gather your materials. Collect roughly 1 cup of each material listed below, and place each item separately into its own individual Ziploc bag. Note: Each material will get its own clear, sealable bag.
- Gravel/rock
- Wood chips or mulch
- Leaves
- Dirt
- Sand
- Grass cuttings
Note: Feel free to add any materials to this list! Look around your backyard and see if there are any other items you would like to add to this experiment.
Step 2
Next, label and seal each bag for the data collection process.
Note: Make sure you do not block the sun’s light with a label. For example: label the item at the bottom corner of the bag or at the top where the bag zips.
Step 3
Create the data collection chart. Using your science notebook or a sheet of paper, create a chart that includes: each material and the outside temperature for both the sun and the shade portions of the experiment in four (4) increments – 30 minutes, 60 minutes, 90 minutes, 120 minutes.
See chart below for reference:
| Time in the Sun | Time in the Shade | |||||||
| Time of data Collection | 30 min (in the sun) | 60 min (in the sun) | 90 min (in the sun) | 120 min (in the sun) | 30 min (in the shade) | 60 min (in the shade) | 90 min (in the shade) | 120 min (in the shade) |
| Temperature Outside | ||||||||
| Gravel/Rock | ||||||||
| Wood Chips | ||||||||
| Leaves | ||||||||
| Grass | ||||||||
| Dirt | ||||||||
| Sand | ||||||||
Step 4
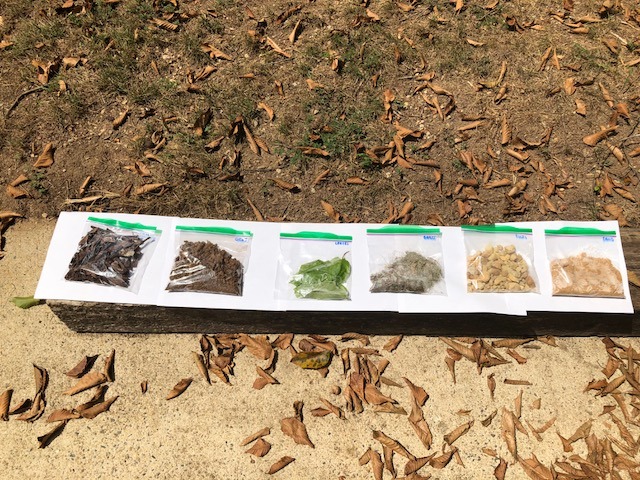
Prep the experiment location. Find a sunny location outside with direct sunlight. Be sure that trees, building, or other tall objects will not block the sunlight for a two (2) hour period. The location must get at least 2 hours of full sun. Place each plastic bag of materials on a white piece of paper (printer or construction paper), leaving about on (1) inch of space between each bag. Finally, select a location where there will be 2 hours of shade for the second part of the experiment.
Note: The bags are placed on a piece of white construction paper so that only the materials in the bag will absorb the sun’s heat. If the surface below the materials were a dark color, it could skew the internal temperature of each item because dark colors absorb more light energy (heat).
Step 5
Collect data! The experiment is broken down into two (2) separate data collection locations: a sunny spot and a shaded spot.
Collect Data - Sunny Spot
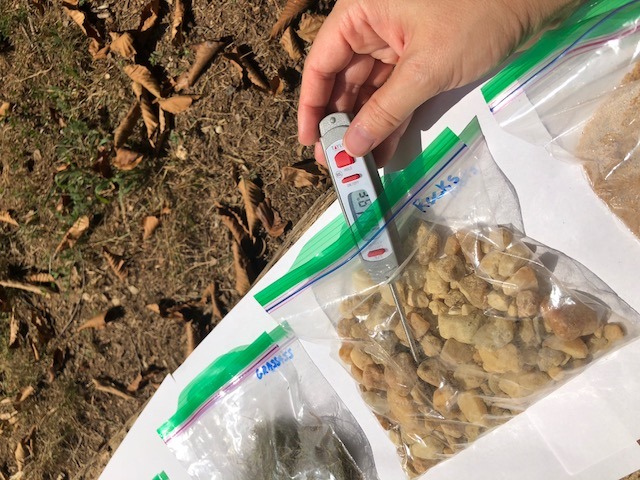
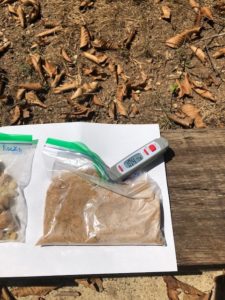
Every 30 minutes for 2 hours (120 minutes), take both the temperature outside, as well as the internal temperature of each bag of materials. To do this:
- Use an outdoor thermometer or a weather app to record the temperature outside, and record the information on the chart.
- Use the cooking thermometer to gather the internal temperature of each material and record the data on the chart. Note: you will need to unzip the bags slightly to complete this step. If you find condensation is an issue, leave the bags open during the experiment.
- Continue to take readings for both the outside temperature and the internal temperature of each bag of material every 30 minutes for two (2) hours.
- While collecting the data, try to find patterns and make observations about each material and the outside temperature.
Collect Data - Shaded Spot
After two (2) hours of recording the temperatures in the sun, move the bags and white paper to a completely shaded area. Then, move onto the data collection in the second location (in the shade), by completing the following tasks:
- Use an outdoor thermometer or a weather app to record the temperature outside and record the information on the chart
- Use the cooking thermometer to gather the internal temperature of each material and record the data on the chart.
- Continue to take readings every 30 minutes for 2 hours.
- While collecting the data, try to find patterns and make observations about each material.
Step 6
Take a look at the data. Find patterns and other observations about each material and the temperature in both the sun and shade. Do this before moving to the “Results/Review” section.
Results/Review
Before diving into the data and analyzing the temperatures, it is important to state that the below data was recorded during peak sun hours (12pm-4pm) and also during a hot and sunny month of summer. With this information stated, take a look at the patterns and trends.
| Time in the Sun | Time in the Shade | |||||||
| Time of data collection | 30 min (in the sun) | 60 min (in the sun) | 90 min (in the sun) | 120 min (in the sun) | 30 min (in the shade) | 60 min (in the shade) | 90 min (in the shade) | 120 min (in the shade) |
| Temperature Outside | 91 | 91 | 92 | 92 | 92 | 92 | 92 | 92 |
| Gravel/Rock | 107 | 130.9 | 135.5 | 137 | 90.7 | 84.9 | 84.8 | 83.6 |
| Wood Chips | 119.8 | 128.1 | 139.9 | 145.3 | 91.9 | 87.5 | 84 | 84 |
| Leaves | 124 | 130.9 | 135.2 | 136.5 | 85.2 | 83.8 | 83.6 | 83.6 |
| Grass | 124.1 | 136 | 137.1 | 139.1 | 88.7 | 82.4 | 82.4 | 82.4 |
| Dirt | 119 | 127.7 | 135.2 | 140.1 | 88.1 | 86.3 | 84.7 | 83.7 |
| Sand | 104.7 | 125.3 | 129 | 130.4 | 83.7 | 83 | 82.6 | 82.5 |
Trend 1: During the portion of the experiment when the materials were in the direct sunlight, most of the materials reached an internal temperature between 130 to 140 degrees Fahrenheit when the outdoor temperature increased. The two outliers of the experiment were: 1) the dark colored wood chips that reached an internal temperature of 145 degrees on the high end, and 2) the sand with 130.4 degrees on the lower end.
Trend 2: The leaves and grass seemed to mimic each other rather closely during both the sun exposure (absorption) and the shaded section (retention) part of the experiment. The leaves reached an internal temperature of 136.5 degrees while the grass reached an internal temperature of 139.1 degrees. The slight variation may have been due to the clumps of soil that remained with the grass roots. During the retention section of the experiment (shade), both the grass and leaves lost their overall thermal heat quickly and remained around 83 degrees after 2 hours.
Trend 3: The dark materials (wood chips and dirt) absorbed the most heat during the experiment which makes complete scientific sense! Darker colored objects absorb more light, which in turn creates a higher internal temperature.
Trend 4: The sand absorbed the least amount of heat through passive solar heating and also lost the solar heat energy the fastest when placed in the shade. This was due to the light coloring of the sand and the heat capacity of the material (which will be discussed in the next section).
Trend 5: All of the materials retained just a small amount of the solar heat obtained during the sunlight absorption section. In fact, all the materials quickly lost heat and seemed to level out at about the same temperature after 2 hours of no sun.
Conclusions:
After looking at the data more closely and identifying trends and patterns, it is important to discuss the idea of specific heat capacity for different materials. Specific heat capacity is the heat or energy required to increase the temperature of a material by 1 degree Celsius. Let’s break that down a little more: think of specific heat capacity as the amount of energy (in this case solar thermal energy) transferred to an object where the result is an increase in the temperature (an increase in degrees Fahrenheit). When we look at the data from this experiment, the varying increases in temperature shows the different specific heat capacity of each material. Each material has its own specific heat capacity and therefore reacts differently to solar thermal energy (in this case, passive thermal heating) and the retention of that heat.
With this idea in the forefront of the experiment, think about specific heat capacity and solar thermal energy when it comes to the earth’s surface.
- What is the effect of a materials specific heat capacity on the earth’s surface?
- What is happening to our earth as solar thermal energy heats the land during the day and cools at night?
- Do all objects have the same heating capacity?
- Do you think building materials for homes and other structures take into consideration specific heat capacity and solar thermal energy?
- In a more extreme case, what would the specific heat capacity of an object look like if the solar thermal energy (the sun’s heat) was removed completely from the equation?
With the help of an adult, look into these ideas further and become a master of all things solar thermal energy! From passive solar heating to the specific heat capacity of a material, the sun is an amazing and integral part of our lives on planet Earth.
Extension:
Variations to Experiment
Parents, feel free to try the following variations to the experiment:
- Vary the materials placed in the bag. All of the items from the experiment were items found in nature, what happens if we use “man-made” items?
- Try altering the time of the experiment. Complete the experiment during the morning or evening hours and then conduct the experiment during peak sunlight (12-4pm)
Extension/Study Questions
- What is solar thermal energy?
- What is passive thermal heating?
- What is specific heat capacity?
- Why do you think the sun is such an important renewable resource for both humans and plants?
- With adult supervision, research what would happen to our planet if the sun were to be taken away (no light or heat)? Could we continue to survive and for how long?
- How do you figure out the specific heat capacity of an object?
For more easy science experiments and solar science fun, check out other projects like our Sundial Science Experiment, DIY Solar Oven, use an eggshell to test the effects of acid rain, make a DIY thermometer using a plastic bottle and colored water, or try indoor activities like Testing Your Home Air Quality.

")

Want to learn more about Community Solar?
Our solar specialists can provide a free consultation.
Get Started